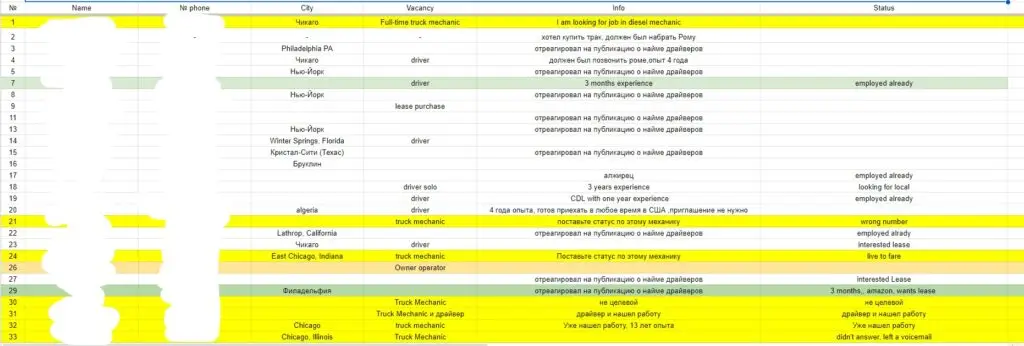
Сбор всех необходимых данных для анализа эффективности не является проблемой, если у вас правильно настроена CRM система.
Оценка эффективности работы с транспортными компаниями (CDL и не-CDL) состоит из двух частей.
Первый — это эффективность самой лидогенерации, то есть расчета и анализа конверсии органического трафика и рекламы в лиды (заявки).
Второе — конверсия сгенерированных лидов в закрытые вакансии водителей.
Сбор всех необходимых данных для анализа эффективности не является проблемой, если у вас правильно настроена CRM система.
Однако за 3,5 года работы по продвижению ниши найма водителей у нас не было ни одной компании-клиента, у которой была бы CRM.
Рассказываю, как наше агентство решает задачу оценки эффективности проектов в таких условиях.
Первая часть (анализ конверсии органического трафика и рекламы в лиды) обычно не вызывает затруднений. Здесь все необходимые данные берутся напрямую из рекламных аккаунтов.
Основными показателями являются коэффициент конверсии (CR) и стоимость лида (CPL).
В начале проекта их значения принимаются на уровне гипотез, а затем формируется KPI как микроконверсия из полученных статистических данных.

Вторая часть (конвертация лидов в закрытые вакансии) может быть более сложной, так как обработка лидов и закрытие вакансий происходит на стороне Клиента.
То есть общение с потенциальными водителями уже ведут сотрудники компании Клиента, а значит, все данные о качестве лидов находятся у них.
На этом этапе очень важна правильно выстроенная аналитика, данные для которой будут передаваться в агентство регулярно и своевременно. Я уже писал об этом.
Итак, какую систему мы предлагаем для анализа?
Все полученные лиды заносятся в электронную таблицу Google. Она должна включать:
- дату получения лида;
- канал, с которого был получен лид;
- данные лида (имя, фамилия, местонахождение, контактные данные);
- подробная информация об опыте работы, если она запрашивается на этапе сбора лидов.
Далее необходимо указать дату ответа сотрудником компании. Это даст понять, насколько быстро с лидом связались после получения заявки.
И, конечно, результат первого контакта.
Очевидно, что одного контакта с кандидатом не всегда достаточно для полной квалификации лида (как релевантного или нет).
В таких случаях в таблице горизонтально фиксируется каждый контакт с конкретным кандидатом (переписка, звонок, визит в офис) с указанием даты контакта и результата.
Для нерелевантных лидов обязательно необходимо указать причину отказа от работы, независимо от того, отказался ли водитель или отказала компания.

По мере накопления данных в такой таблице, помимо коэффициента конверсии лидов в задания, мы можем получить еще несколько очень полезных параметров.
1. Среднее время найма водителя.
Оно показывает сколько времени проходит с момента получения заявки (лида) до найма водителя. Это важно не только для расчета эффективности продвижения, но и для оптимизации процессов внутри компании.
2. Количество контактов с кандидатом до принятия решения.
Среднее значение этого параметра также поможет оптимизировать процессы компании.
3. Причины отказов в сотрудничестве.
Этот параметр, конечно, должен постоянно контролироваться как Клиентом, так и агентством.
Для агентства как подрядчика это важнейшая информация об актуальности (корректности) настроек рекламы и офферов.
Для самой компании это может быть показателем привлекательности на рынке для потенциальных сотрудников.
Ключевыми данными для окончательной оценки эффективности данной таблицы будут количество закрытых вакансий и среднее время найма.
Понимание количества закрытых вакансий за определенный период времени позволяет нам рассчитать
- стоимость закрытия каждой вакансии;
- коэффициент конверсии лидов в закрытые вакансии;
- наиболее эффективные каналы для генерации релевантных лидов.
И очень важно не забывать о среднем времени найма. Ведь стоимость закрытия вакансии следует относить к периоду получения лида, а не к моменту закрытия вакансии.
Например, если заявка была получена в апреле, а водитель приступил к работе только в июне, то и расходы на его привлечение логично считать апрелем.
Но это при условии, что пользователь повторно не переходил с рекламы в период с апреля по июнь.
Очевидно, что стоимость закрытия вакансии будет выше стоимости лида в среднем на величину, кратную коэффициенту конверсии лида в вакансию.
И именно эту стоимость следует принимать при расчете KPI.
Что еще?
Все эти данные также помогают более точно прогнозировать дальнейшие активности, чем данные только из рекламных аккаунтов.
Например, вам необходимо набрать 10 водителей.
Зная среднюю стоимость закрытия вакансии, легко рассчитать рекламный бюджет, а также понять, по какому каналу быстрее получить нужные лиды.
Плюс, вы можете спрогнозировать время закрытия этих 10 вакансий.
Посмотрите наши кейсы с траковыми компаниями
Свяжитесь с нами, если вашему бизнесу требуется качественное продвижение